 SolarAnywhere Posts | Nov 14, 2013
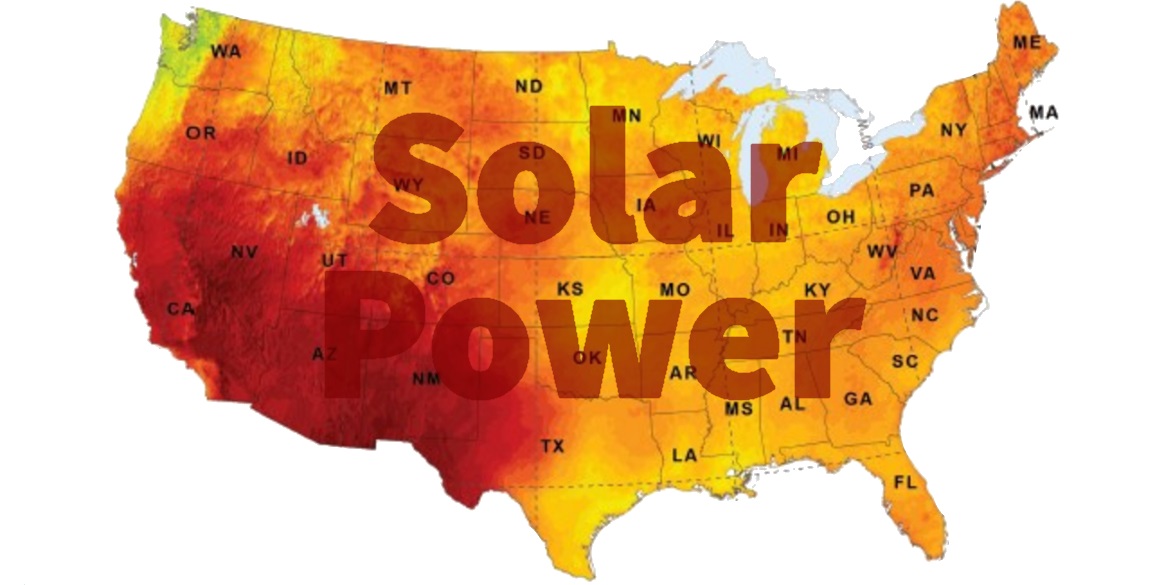
Determining whether solar is right for you depends in large part on the amount of solar resource available where you live. Each month, we generate the PV Power Map using SolarAnywhere® irradiance data. These maps provide more than just an indication of the solar...

 SolarAnywhere Posts | Jul 17, 2013
As we discussed in an article last month, it’s no secret that solar power generation can vary from season-to-season based on local weather conditions. So given this variability, how do PV system owners—whether residential, third-party, commercial or utility-scale...

 SolarAnywhere Posts | Jun 19, 2013
Intuitively, we know that solar power generation is dependent on seasonal weather conditions. The January and February PV Power Maps, published in the May/June 2013 issue of Solar Today, illustrate that this year was no exception, with month-to-month variability...

 SolarAnywhere Posts | May 2, 2013
Not only was 2012 a record-shattering year for PV system growth in the U.S., it was also a good year for solar power production. Compare our monthly average maps for 2011 and 2012 to see that many locations in the U.S. experienced significantly higher PV energy...

 SolarAnywhere Posts | Mar 14, 2013
Have you ever wondered if PV system orientation really makes that much difference to the amount of power produced by a PV system? As the map below illustrates, the answer is typically yes, but to varying degrees. This ‘Energy Gains’ map depicts how tilting solar...


