Scalable DER data and insights for distribution system planning and grid operations
With increased adoption of behind-the-meter distributed energy resources (DERs), the use of traditional forecasting and planning practices can lead to blind spots in grid operations and uncertainties in distribution planning.
FleetView is a scalable data and insights platform designed to support distribution system planning, engineering and operations. Using dependable data sources and bottom-up modeling, FleetView provides distributed generation simulations that seamlessly aggregate meter-level insights at any level—from feeders to substations and beyond.
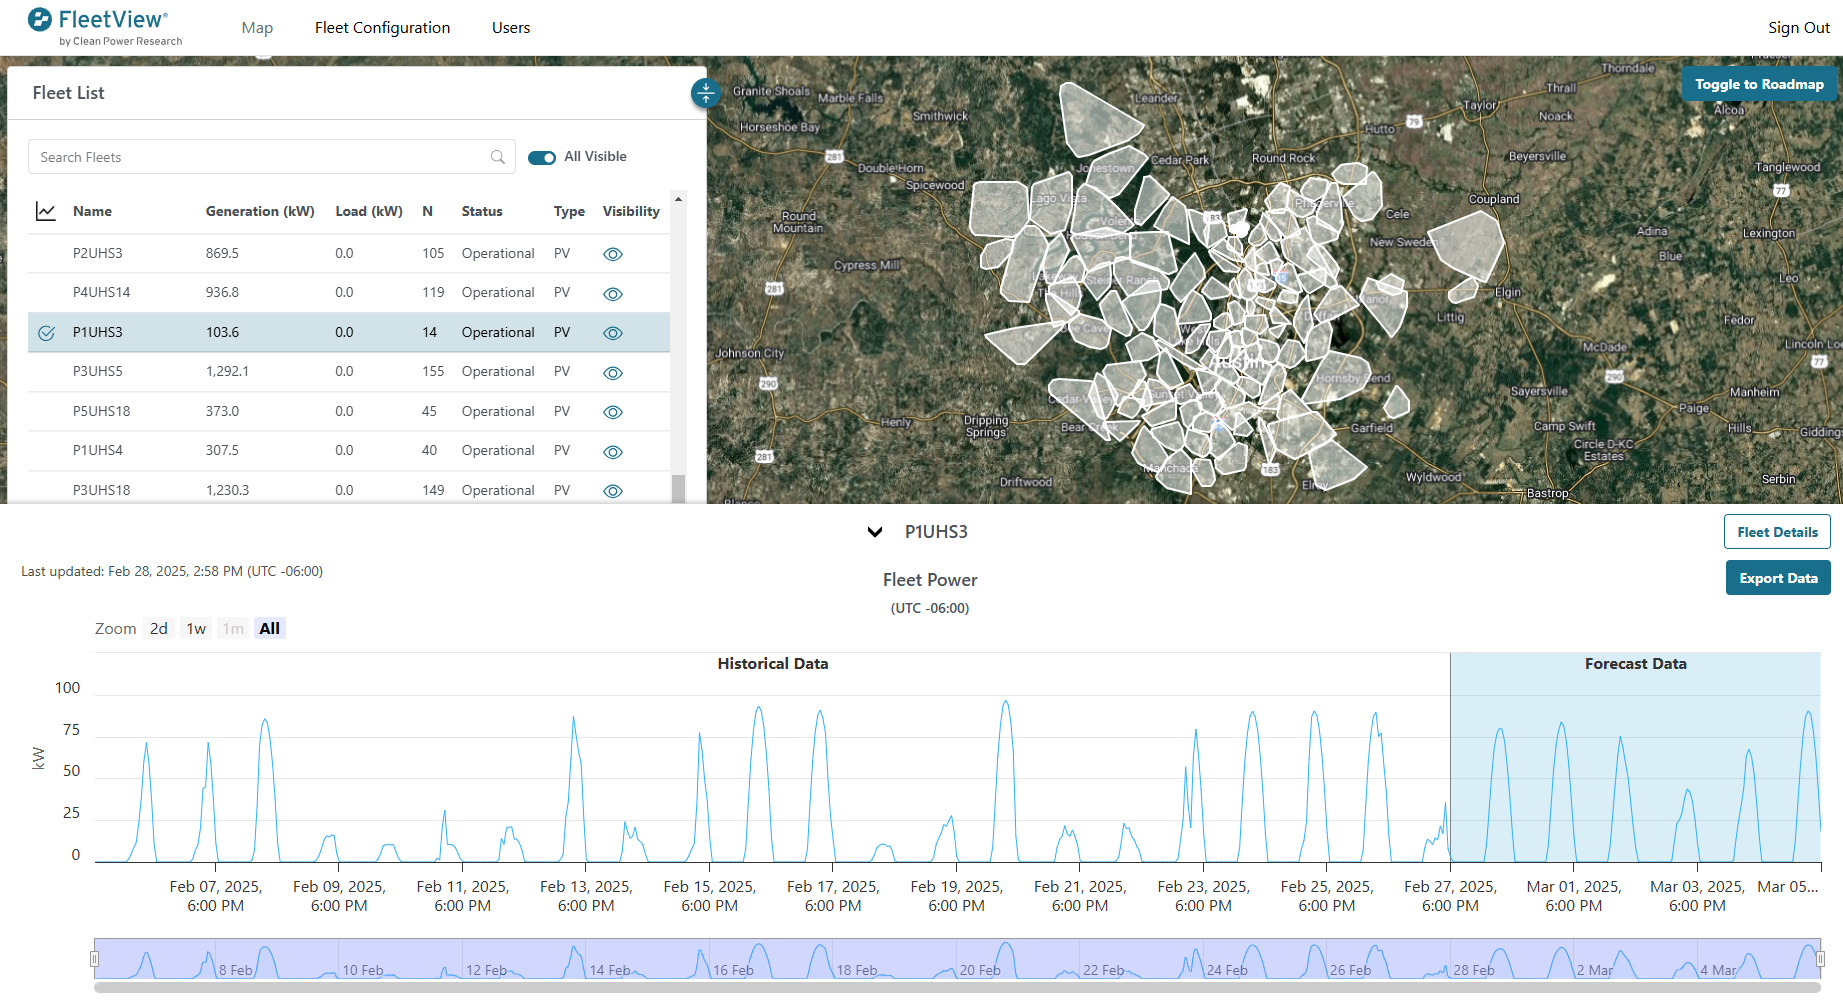
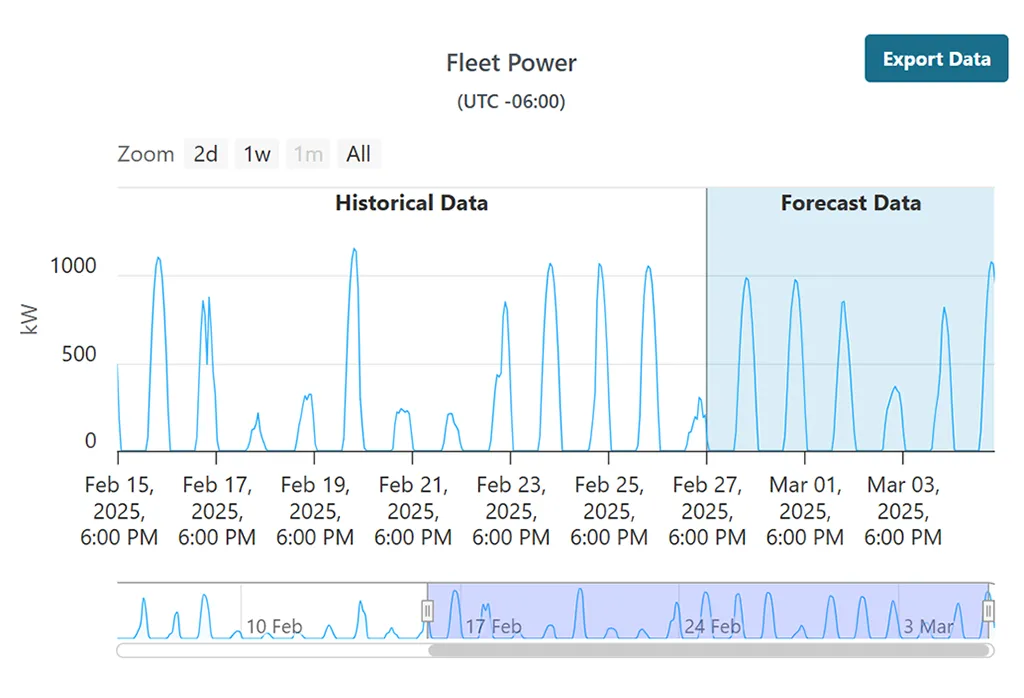
Visualize simulated DER power output with FleetView

Solutions for planning, engineering and operations
Planning and Engineering
Unmask gross loads to improve forecasting
Use precise PV simulations at the interconnection point or aggregated at any grid level to accurately reconstruct gross loads.
Uncover critical insights during peak events
Conduct grid impact studies to capture extreme weather events using time-series simulations that incorporate smoke, snow, soiling and other load-altering effects.
Keep DER impact analyses up to date
Avoid stale power flow analyses by updating DER impact analyses as DERs come online, without any dependence on metered data.
Enable intelligent DER integration
Safely increase utilization of existing grid infrastructure through non-wire alternatives informed by probabilistic time series DER simulations.
Operations
Rely on low-cost, reliable DER data inputs
Understand behind-the-meter DER behavior to support ADMS, DERMS or other operational tools without the need for expensive metering or device integrations.
Confidently predict extreme-weather DER performance
Enhance reliability and resilience by using sophisticated data blending methods and bottom-up energy models to better predict DER performance during extreme weather.
Integrate DER generation estimates for seamless decision-making
Directly integrate DER generation estimates into existing applications via an enterprise-class API.
Support advanced grid control strategies with higher accuracy
Trusted simulation methods that have been demonstrated for use in optimizing battery and volt/VAR control.
Exploring DER impacts with FleetView simulations
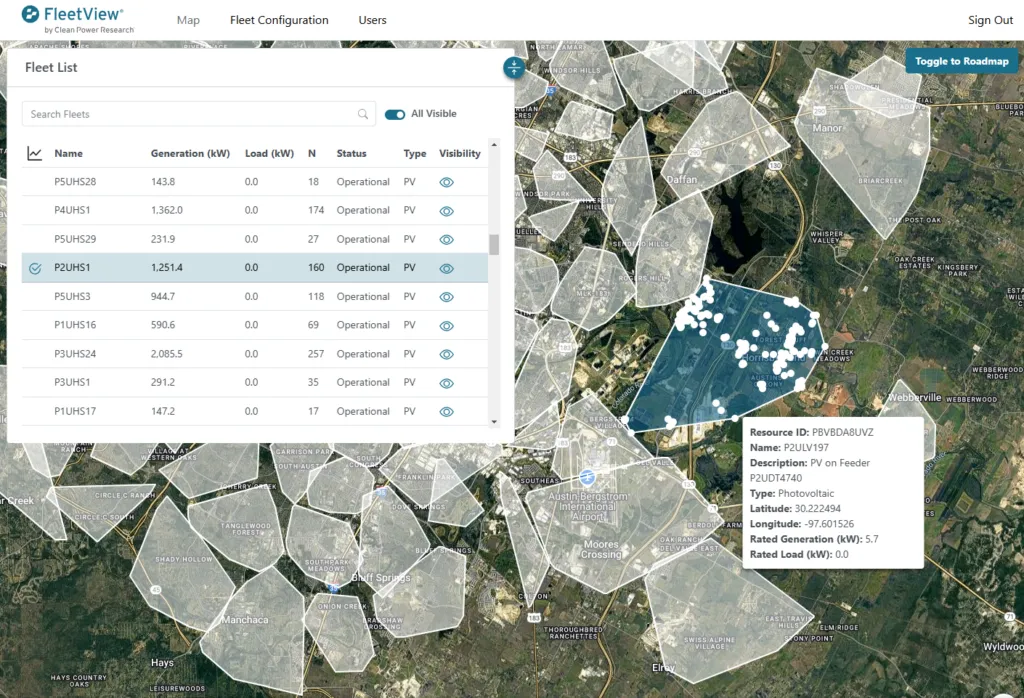
Reassign DERs to new fleet aggregations, review and edit system specifications and visualize simulated power output.

Browse fleets and constituent DER specifications on an interactive map.

View DER simulation data, download as a CSV file, configure SFTP delivery or query via the API.
FleetView features
Flexible DER configuration
- Import DER specifications via file upload in FleetView
- Integrate with your PowerClerk program(s) to automatically synchronize DER information as it is added or modified
- Use the FleetView API to synchronize with other asset tracking systems or make bulk updates
- Leverage patented inference models to fill in DER specification data gaps using AMI data
- Flexibly define fleets as custom collections of DERs tailored to your use case
Scalable simulation options
- Simulate historical or forecasted PV production with up to 15-minute temporal resolution and 1km spatial resolution
- Get meter-level insights or seamlessly aggregate generation to any grid level
- Fine-tune PV power model parameters to capture effects like losses from snow, soiling and smoke
- Augment power output simulations using probabilistic irradiance and other weather data, such as temperature, precipitation and wind speed
- Configure the simulation update frequency to meet your needs: daily, monthly or custom
Seamless delivery
- Retrieve data via the API to perform bulk queries or build integrations with ADMS, DERMS or other operations and planning tools
- Browse and download simulation data directly from the web portal
- Schedule data deliveries via secure file transfer

Case Study
Exelon Companies Choose FleetView
FleetView calculates behind-the-meter PV generation to inform gross load calculations and distribution planning.
Three Exelon companies (Atlantic City Electric, Delmarva Power and Pepco), experienced accelerated growth of residential solar installations in their service territories. In order to provide safe and reliable service while supporting solar adoption, the company needed the ability to accurately and cost-effectively estimate customer gross load that is obscured by behind-the-meter PV systems
“FleetView provides us with accurate and site-specific solar production simulations of historical and real-time production for every PV system in our territory. This helps us unmask gross load, plan for the future and bolster continued reliability of the distribution system.”
Scott Placide
Former Manager (DER Engineering), Exelon
FleetView distributed PV power production simulations
| Access Point | API, SFTP, AWS S3 or direct download via web platform |
| Time Period |
Historical: 1/1/1998 up to past hour
Forecast: One-hour ahead up to 14-days ahead |
| Geography | Global up to 80° N/S |
| Temporal Resolution |
1-hour, 30-minute, 15-minute, 5-minute1 |
| Spatial Resolution |
10km, 1km, 500 m1 |
| PV System Data Options | PowerClerk® integration, Clean Power Research PV specification inference model, API import or custom file import |
| Data Fields |
Power Modeling Irradiance Weather |
| Data Types |
Historical Time-series Data |
1 See SolarAnywhere Geographic Coverage Area for more details.

