No Results Found
The page you requested could not be found. Try refining your search, or use the navigation above to locate the post.
No Results Found
The page you requested could not be found. Try refining your search, or use the navigation above to locate the post.
Lessons from SEPA’s Utility Solar Conference Part 2: Stop worrying about rooftop solar (start focusing on opportunities)
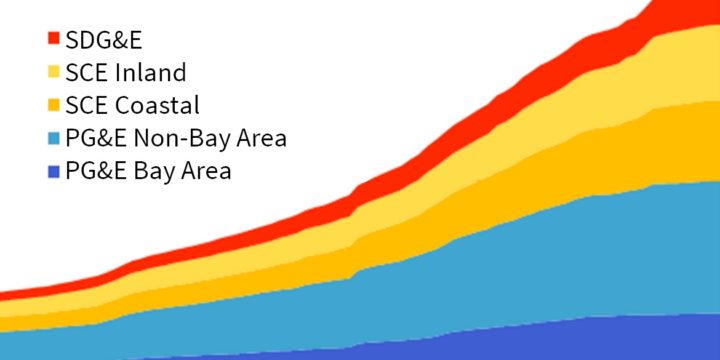
For all the talk of utility death spirals, a single graph from GTM Research’s Shayle Kann, presented at the recent Solar Electric Power Association’s (SEPA) annual Utility Solar Conference (USC), should give U.S. utilities significant comfort that residential solar...
Lessons from SEPA’s Utility Solar Conference Part 1: Get electric rates right to fill the belly of the duck
The Solar Electric Power Association’s (SEPA) annual Utility Solar Conference (USC) is the premier utility solar conference in the United States, and the in-depth discussions between utility and industry leaders can be counted on to portend where solar is heading. At...
UVIG technical achievement award presented to Tom Hoff
Last week, the Utility Variable-Generation Integration Group (UVIG) recognized Tom Hoff, Clean Power Research founder and president of Research and Consulting, with an award for his ongoing contributions to solar forecasting. The ability to forecast the output of tens...
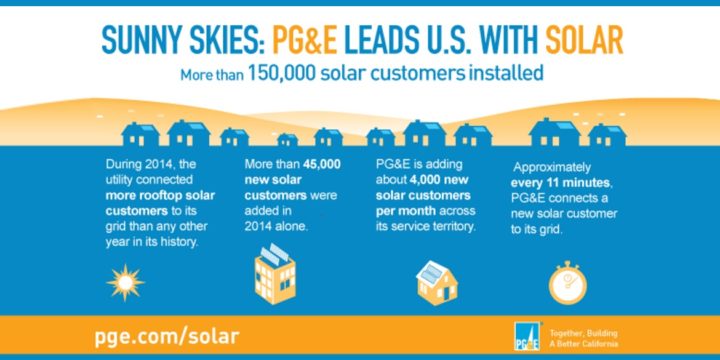
Connecting 150,000 solar customers to PG&E’s electric grid
This week, Pacific Gas & Electric (PG&E) announced a major milestone: connection of 150,000 solar customers to their electric grid. This achievement is the result of PG&E’s long commitment to supporting their customers going solar, and comes with some...
Solar + storage in Hawaii: Making cents of time-of-use economics
As Hawaii works through a host of complex interconnection issues, the solar industry is taking a fresh, new look at energy storage. Grid-connected storage has been around for years, promising a wide array of uses—from energy arbitrage and frequency regulation, to...
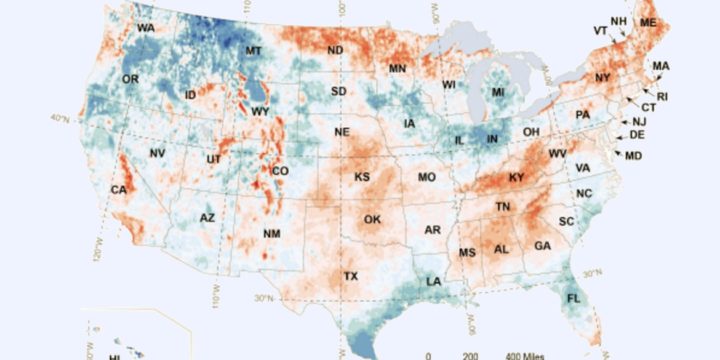
When it comes to solar resources, 2014 was anything but average
Solar resources naturally vary from year to year, and 2014 was no exception. While the 2014 average monthly solar resource map shows expected patterns, with the greatest energy output in the southwest, the real story is revealed by the PV power variance map. The PV...
Our top 3 in 2014
In 2014, we covered a wide range of topics on the Clean Power Research blog, from the differences between solar resource datasets, to deep dives into value of solar calculations. The top three posts of the year followed suit, reflecting interest in topics that address...
Solar forecasting goes “EPIC”
Itron and Clean Power Research are embarking on the next phase of research that will lead to high-fidelity distributed solar photovoltaic (PV) forecasts, and integration of those forecasts into net load forecasts for the California Independent System Operator (ISO)....
U.S. solar trends: 2015 edition
As everyone recovers from their New Year’s Eve festivities, shakes off the cobwebs and gets back to work, it’s time for our annual look at trends and predictions for the coming year. Who knows if we’ll be right, but it’s always fun to prognosticate. Here are the three...
No Results Found
The page you requested could not be found. Try refining your search, or use the navigation above to locate the post.
No Results Found
The page you requested could not be found. Try refining your search, or use the navigation above to locate the post.
No Results Found
The page you requested could not be found. Try refining your search, or use the navigation above to locate the post.
No Results Found
The page you requested could not be found. Try refining your search, or use the navigation above to locate the post.
No Results Found
The page you requested could not be found. Try refining your search, or use the navigation above to locate the post.
No Results Found
The page you requested could not be found. Try refining your search, or use the navigation above to locate the post.


