No Results Found
The page you requested could not be found. Try refining your search, or use the navigation above to locate the post.
No Results Found
The page you requested could not be found. Try refining your search, or use the navigation above to locate the post.
PowerClerk Dashboards deliver key data visualization capabilities to energy program managers
Advancements in data visualization reporting tools are helping companies make sense of ever-increasing data volumes and complexity. The right tools help increase efficiency and make data visualization more approachable for all users. Improved application design has...
Demand for firm power driving innovation in solar forecasting
Since 2014, compelling economics have made renewable energy the preferred source of new power generation capacity in the United States. Energy cost parity with traditional sources has been well-established by the International Renewable Energy Agency (IRENA) and other...
As community solar grows, scaling customer engagement is critical
Solar energy production is booming in the United States. According to the EIA (U.S. Energy Information Administration), “U.S. solar generation has increased from 2 million MWh in 2008 to 96 million MWh in 2018.” The growth of solar has coincided with the proliferation...
What U.S. PV plant owners have seen in 2018/2019 is real: sunshine has been scarce
What it means to PV plant owners and developers For many solar PV plant owners in the U.S., solar energy production in the last year or two has fallen well below expectations. We’ve heard this again and again recently. Maybe you’ve heard the same thing. What’s causing...
Move beyond worst-case distribution planning with DER adoption forecasts and probabilistic planning
Distribution engineers today are responsible for designing the future of a critical infrastructure system, yet uncertainty pervades the process. Traditional methods of load forecasting and system planning are becoming less tenable due to the growth of distributed...
Strategies for managing multiple DER programs
In spite of the industry definition of distributed energy resources (DERs) continuing to evolve, consumers are increasingly adopting DERs—often more than one. This means that for utilities, DER program management such as interconnection doesn’t end at “permission to...
New SolarAnywhere® bankable data, expanded geographic coverage, model validation and more
Clean Power Research has officially released SolarAnywhere® Data version 3.3, making it our most up-to-date bankable dataset for resource assessment, operational monitoring and forecasting solar PV. In the new version, 21 years of data are represented in the new...
PowerClerk®: The proven solution for more than one million DER applications
The past two years have seen key milestones for distributed energy resource (DER) adoption in the U.S., including: Passing one million total residential solar installations in 2017. All solar generation (including residential, commercial and utility scale) in 2018...
Make the most of your DER interconnection data: virtual metering
In a previous blog post, we detailed the responsibility of distributed energy resource (DER) interconnection managers to capture DER system specifications for their system planners and distribution engineers. Since then, even more U.S. utilities have turned to...
No Results Found
The page you requested could not be found. Try refining your search, or use the navigation above to locate the post.
No Results Found
The page you requested could not be found. Try refining your search, or use the navigation above to locate the post.
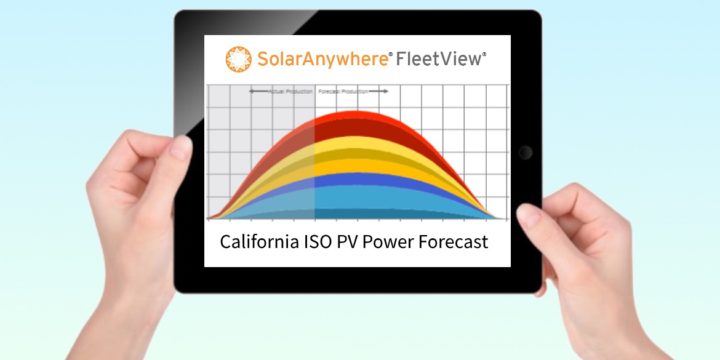
CSI RD&D project results: Forecasting behind-the-meter PV for the California ISO
In a recent NREL report, interviews of 13 operating entities in the Western Interconnection found that “Variable generation (VG) forecasting is widely considered to be a key means of integrating wind and solar power efficiently and reliably as these resources become...
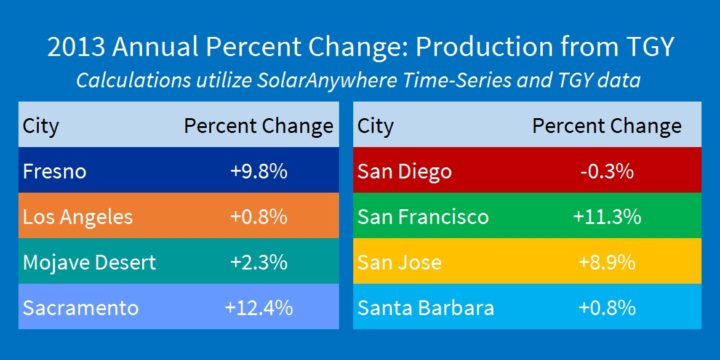
Just how great was the solar resource in 2013 in California? Record setting!
2013 marked the driest year on record in most regions of California. While this weather pattern led to many brown lawns and thirsty reservoirs, clear skies allowed many locations to experience well above-average PV energy generation potential. To better understand...
The solar value proposition part 2: Charting a new path using data and analytics
In Part 1 in our series on the solar value proposition, we looked at a new approach to valuing PV. With this new approach, there is a need to quantify deferred and avoided generation, as well as transmission and distribution capacity increases through peak-load...
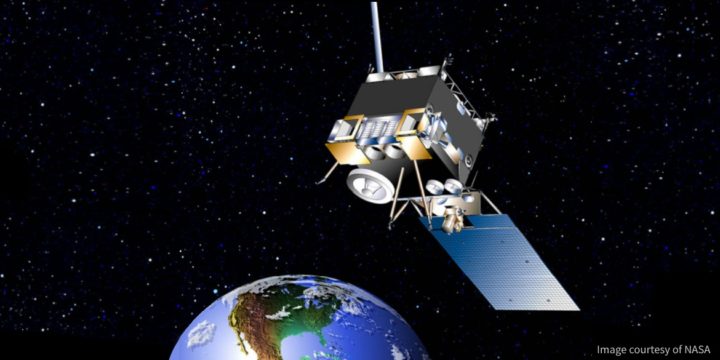
Solar forecasts generated from satellite images help balance power grid
What do NASA and NOAA’s Geostationary Operational Environmental Satellites (GOES) have to do with balancing the power grid? Plenty, it turns out, for areas with a high penetration of solar energy production. Read about the link in NASA’s Energy Innovations blog...
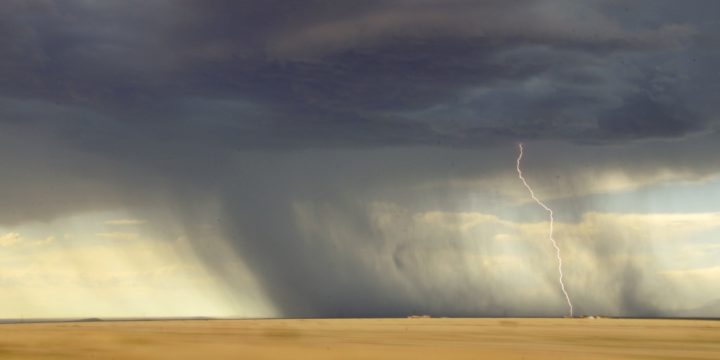
Impact of the North American Monsoon on solar variability
Solar energy output is predominantly affected by seasonal solar variations and weather. The angle of the sun to the solar panel changes with the time of day and seasonal variations, changing the available solar resource in predictable ways. Weather also affects the...
2014 solar trends episode 3: Solar Financing – A New Hope
Financing has been with solar since its earliest days. Before the lease and the power purchase agreement (PPA), residential solar customers would often purchase systems with cash. Cash payments are a form of financing, as the customer is choosing to purchase a solar...
Flexibility meets reliability: PVWatts and NSRDB now available through Clean Power Research API services
In keeping with our mission of powering intelligent energy decisions, Clean Power Research is introducing a 10 km Typical Meteorological Year (TMY) dataset for use in Clean Power Research API services. Programmatic access to this high-resolution dataset and the...
Power from solar: how much can you expect?
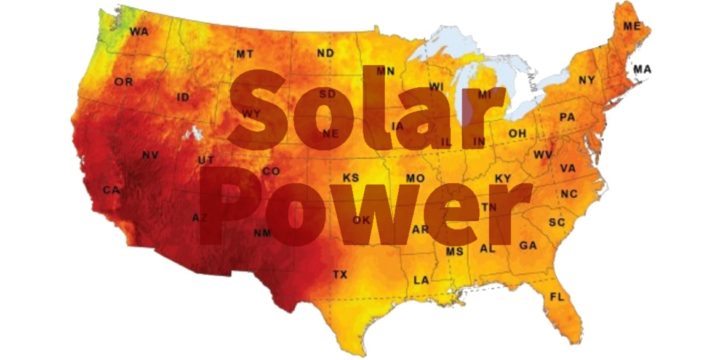
Determining whether solar is right for you depends in large part on the amount of solar resource available where you live. Each month, we generate the PV Power Map using SolarAnywhere® irradiance data. These maps provide more than just an indication of the solar...
Case study: Forecasting production of 170,000+ distributed PV systems
Falling photovoltaic (PV) system prices along with financing and installation innovations are driving continued rooftop solar growth—expected to be 30% in 2013 as reported by GTM Research. These customer-sited power generation resources are increasingly impacting...
No Results Found
The page you requested could not be found. Try refining your search, or use the navigation above to locate the post.
No Results Found
The page you requested could not be found. Try refining your search, or use the navigation above to locate the post.
Hot topics at Intersolar NA 2015: ITC, solar + storage and snow!
San Francisco once again played host to the Intersolar North America conference in July. For industry veterans, this year’s event was familiar: crowded registration lines, bumping into old friends and a busy exhibition floor. On the other hand, this year’s hot...
Five to thrive: Key characteristics of great utility customer engagement
"The utilities that succeed in educating their residential customers may be [the best positioned not only] to survive, but [also to] thrive in the new customer-centric electricity landscape that is now taking shape." – 2015 Utility Residential Customer Education...
Lessons from SEPA’s Utility Solar Conference Part 2: Stop worrying about rooftop solar (start focusing on opportunities)
For all the talk of utility death spirals, a single graph from GTM Research’s Shayle Kann, presented at the recent Solar Electric Power Association’s (SEPA) annual Utility Solar Conference (USC), should give U.S. utilities significant comfort that residential solar...
Lessons from SEPA’s Utility Solar Conference Part 1: Get electric rates right to fill the belly of the duck
The Solar Electric Power Association’s (SEPA) annual Utility Solar Conference (USC) is the premier utility solar conference in the United States, and the in-depth discussions between utility and industry leaders can be counted on to portend where solar is heading. At...
UVIG technical achievement award presented to Tom Hoff
Last week, the Utility Variable-Generation Integration Group (UVIG) recognized Tom Hoff, Clean Power Research founder and president of Research and Consulting, with an award for his ongoing contributions to solar forecasting. The ability to forecast the output of tens...
Connecting 150,000 solar customers to PG&E’s electric grid
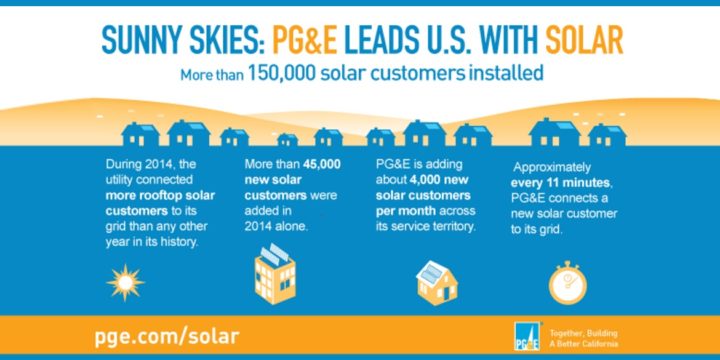
This week, Pacific Gas & Electric (PG&E) announced a major milestone: connection of 150,000 solar customers to their electric grid. This achievement is the result of PG&E’s long commitment to supporting their customers going solar, and comes with some...
Our top 3 in 2014
In 2014, we covered a wide range of topics on the Clean Power Research blog, from the differences between solar resource datasets, to deep dives into value of solar calculations. The top three posts of the year followed suit, reflecting interest in topics that address...
Solar forecasting goes “EPIC”
Itron and Clean Power Research are embarking on the next phase of research that will lead to high-fidelity distributed solar photovoltaic (PV) forecasts, and integration of those forecasts into net load forecasts for the California Independent System Operator (ISO)....
U.S. solar trends: 2015 edition
As everyone recovers from their New Year’s Eve festivities, shakes off the cobwebs and gets back to work, it’s time for our annual look at trends and predictions for the coming year. Who knows if we’ll be right, but it’s always fun to prognosticate. Here are the three...


