Clean Power Research® is excited to announce an enhancement to WattPlan®, our personalized rate and DER customer education and engagement software for utilities and energy agencies. As of July 1st, all rooftop solar estimations on WattPlan sites started using Google’s Solar API to estimate the pitch, size, orientation and shading of the roof planes on the user’s home. WattPlan uses this data to make detailed estimates of the potential solar generation, bill impacts and lifetime savings for our users.
This update makes WattPlan more equitable, accurate and personalized than ever before. Now, utility customers across the United States and Canada can benefit from this additional precision and personalization. With more than 90% of homes covered across the country, it doesn’t matter if the user lives in a rural county or the heart of a major city, they will now receive the same high-quality estimates.
 This chart reflects the measured improvement for our users in the availability of rooftop data across the geographic regions of the United States and for the country overall.
How does WattPlan use rooftop data?
WattPlan helps utility customers understand the costs and benefits of installing rooftop solar on their homes. WattPlan is purchased by utilities and energy agencies who want their customers to have a free and objective way to evaluate the solar potential of their homes and understand how their bills will change after installing rooftop solar.
To simulate a new solar array and the associated costs and savings, WattPlan brings together local solar irradiance data, utility electric rates and programs, and detailed rooftop data, now from Google’s Solar API.
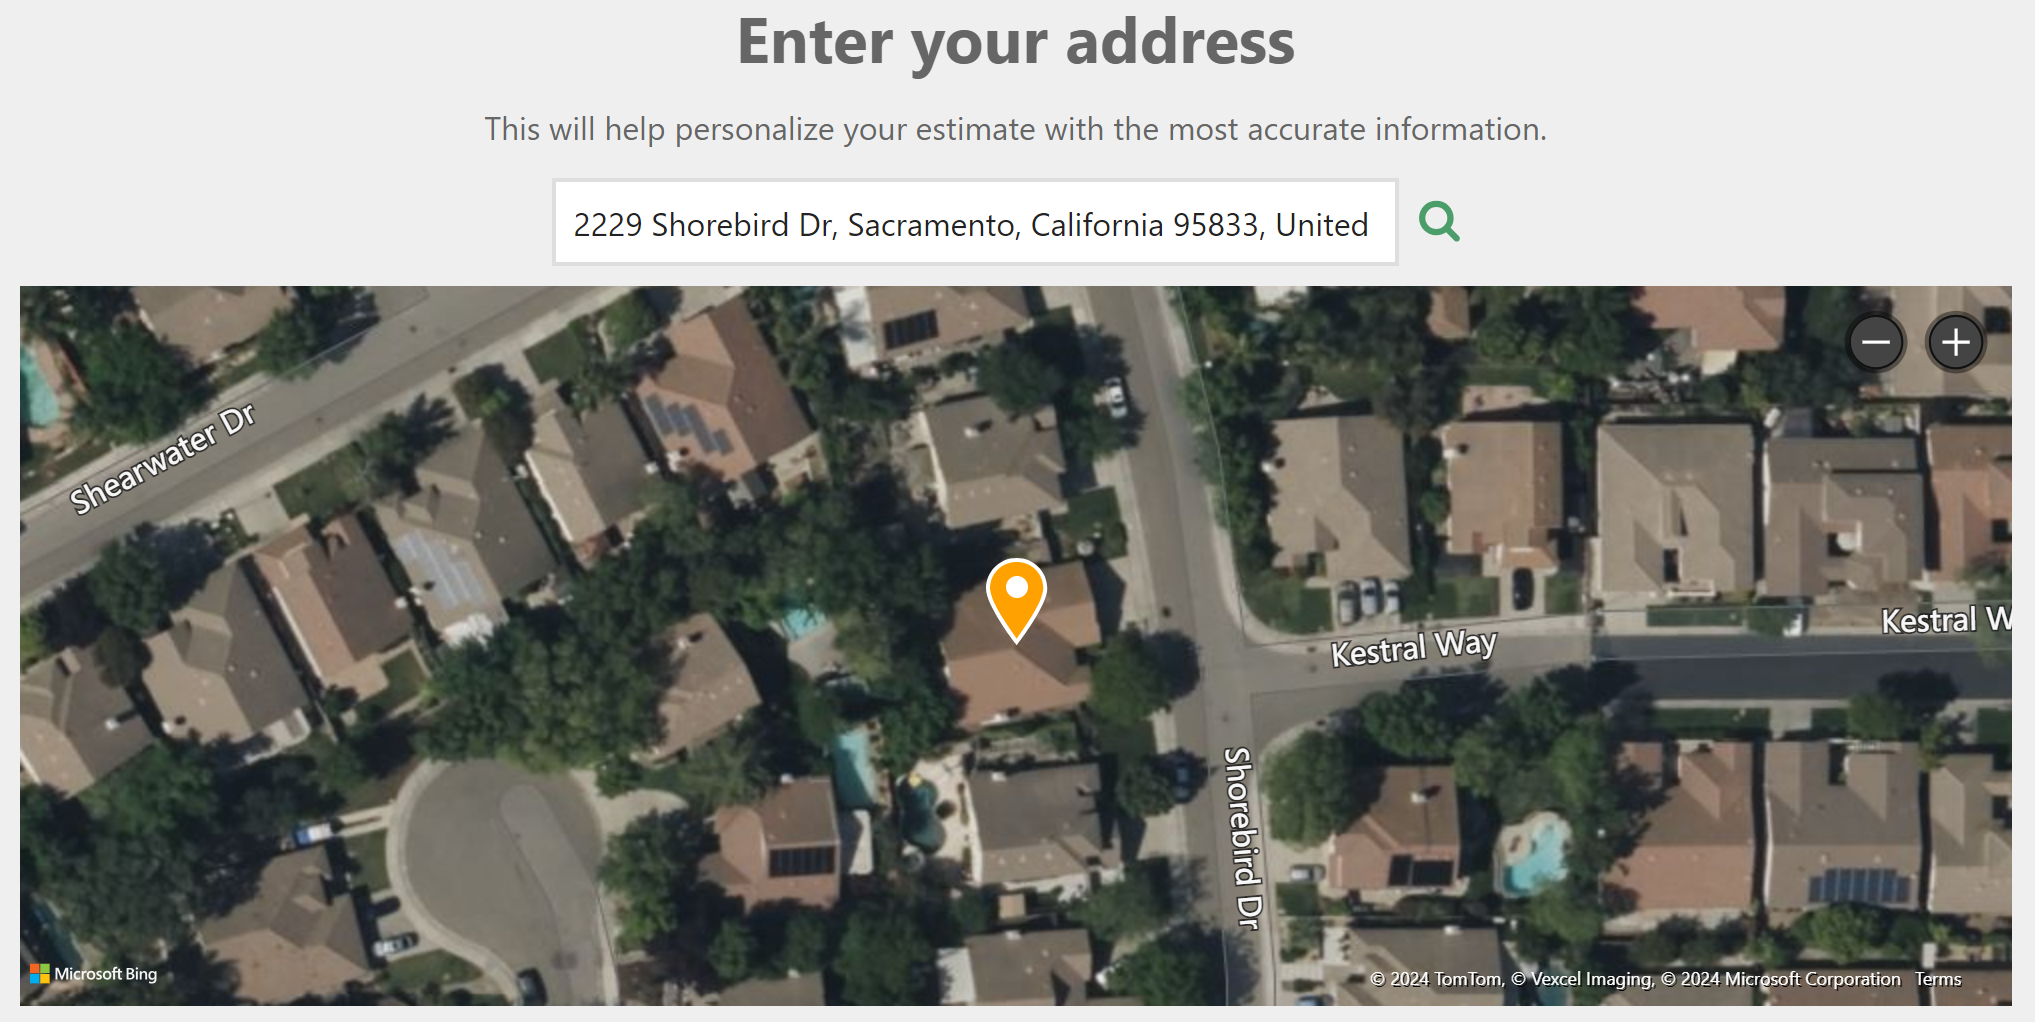
 When users enter their address, WattPlan connects with our own SolarAnywhere® for localized irradiance data to determine how much sun the home will receive throughout the year.
 Then WattPlan collects rooftop data for that address. This data includes the number of planes on the roof, their size, pitch and orientation. These values are crucial to determining the best locations for new solar panels.
 Next, WattPlan collects hourly shading data, which reflects how nearby objects like trees and other buildings impact how much light reaches each plane of the roof throughout the year. This is crucial to accurately simulating the potential for each home.
 Applying these datasets, WattPlan simulates a set of solar arrays which will offset the user’s energy consumption from the grid. The production of the solar arrays is netted against the user’s electrical consumption.
 The resulting utility bills are estimated using Clean Power Research’s in-house rate engine, PowerBill®. Users can see how much the system might cost, how much they might save and how their emissions would change. They can adjust the estimate to emulate solar quotes and consider alternate rate plan and pricing scenarios.
 Click here to try WattPlan now. Note that this public site is only available for residents of Washington, Oregon, and California. WattPlan is available nationwide for our customer utilities, cooperatives, municipalities and energy agencies.
To learn more about how WattPlan could benefit your customers, visit our website. If you are a program or product manager at a utility or energy agency and you are looking for ways to educate your customers, protect them from deceptive installers or promote your solar programs, be sure to contact us.
