
- PV orientation and tilt
- Storage capacity
- EV charger make and model
- Etc.
Now that DER interconnection data is being appropriately captured, we turn our attention to what can be done with it. At the February 2019 DistribuTECH conference, PowerClerk® user Alliant Energy showcased the value of accurate DER interconnection data. Using PV interconnection data from PowerClerk in combination with solar irradiance data from SolarAnywhere®, Alliant Energy demonstrated its ‘Virtual Metering’ concept, and the impact to its system and distribution planning.
Virtual metering – a low cost alternative to PV production metering
Like most utilities, Alliant Energy would benefit from behind-the-meter PV production data to evaluate power-quality issues, to reconstruct gross load from net load and to ensure their interconnection requirements are being met.
The challenge for Alliant Energy is that obtaining production data requires additional and/or new metering equipment, and new communication networks. These investments are expensive for the customer and the utility. Worse, they are not yet available, and are subject to regulatory review and approval.
By comparison, satellite-based solar irradiance and PV simulation capabilities are available today through cost-effective services such as SolarAnywhere. In combination with PV interconnection data, SolarAnywhere is providing utilities like Alliant Energy with simulated historical, real-time and/or forecasted solar production.
Case study example: Alliant Energy
As shown in Figure 1, Alliant found that SolarAnywhere accurately matched the hourly solar production of two utility-owned behind-the-meter PV systems for which it had metered production data. The red-curve is the measured production and the blue-curve (often masked by the red-curve) is the simulated solar production. The quality of the match was from a typical period during non-winter months.
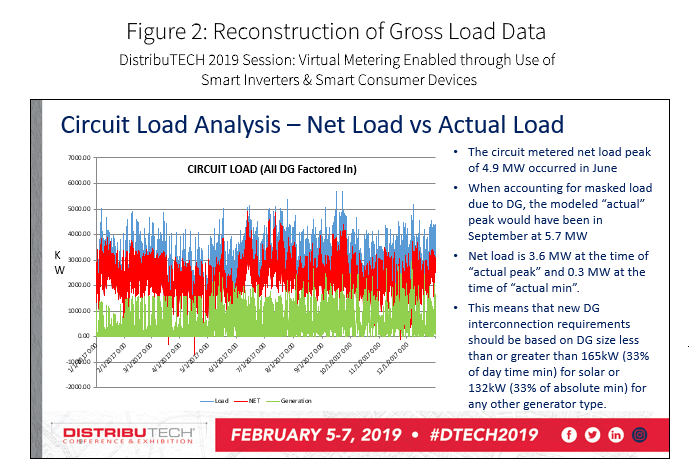
Having verified the accuracy of FleetView, Alliant used their measured net load data in combination with SolarAnywhere production data to reconstruct gross load for key feeders. This allowed Alliant to quantify the peak load reduction that solar was providing. Notably, Alliant discovered that one feeder’s peak load day moved from June to September and that behind-the-meter PV was serving 2.1 MW of the 5.7 MW load at the peak hour.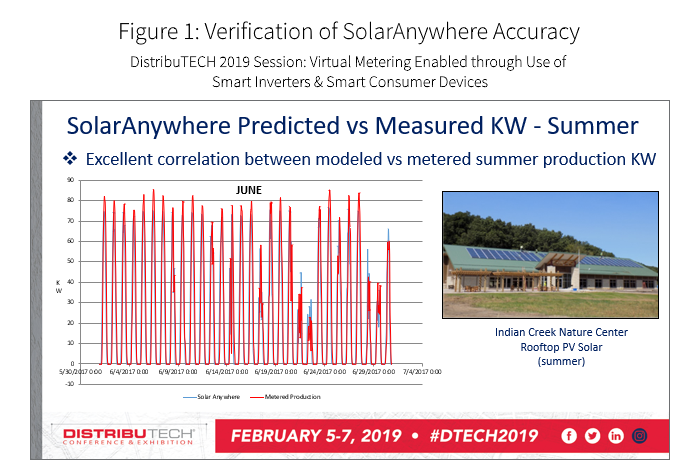
Insights like these are critical when system planners evaluate the potential need to increase the capacity of a given feeder. They are also important when distribution engineers evaluate the reliability of a feeder with additional solar capacity in the interconnection queue.
A general sense of the impact from behind-the-meter PV can be obtained by examining the plot in Figure 2. The green curve is the solar production for every hour of the year. The red curve is the measured net load. The blue curve is the re-constructed gross load. Behind-the-meter PV production is masking meaningful amounts of load most days of the year.
Ultimately, using DER interconnection data from PowerClerk in combination with SolarAnywhere for virtual metering of its behind-the-meter solar PV, Alliant Energy was able to use Synergi Electric® to:
- Identify feeders where interconnection requirements needed updating
- More accurately determine where and when they could expect behind-the-meter PV adoption to produce voltage violations on their distribution grid
Start making the most of your behind-the-meter data
For more information on Alliant Energy’s work with PowerClerk and SolarAnywhere, please contact us for additional details on their DistribuTECH presentation. And, if you’d like to learn more about how you can put your DER interconnection data to use, we’d be happy to discuss these services.